Quick Answer
In California, about 26% of adults ages 25–34 live with their parents, higher than the U.S. average. White adults generally have lower rates compared to Asian, Hispanic, and Black adults. These differences are influenced by housing costs, income levels, and cultural norms, especially in high-cost metropolitan areas.
Over the past decade, living arrangements among young and mid-career adults have shifted in noticeable ways across the United States. One of the clearest signals of this change is the rising percentage of adults that live with parents by race in California, a state often used as a bellwether for national social and economic trends. Recent demographic research shows that a growing share of adults ages 25–34 now reside in their parental homes, reversing patterns common in earlier generations when independent living began earlier. In California, this trend is amplified by a high cost of living, sharp regional housing disparities, and a racially and ethnically diverse population. Rather than looking only at overall averages, researchers increasingly examine demographic living arrangements by race to understand how culture, economics, and opportunity intersect. These patterns matter because they shape housing demand, labor mobility, and long-term household formation across the state.
Table of Contents
2. National Context: Young Adults Living With Parents in the U.S.
Understanding California requires placing it within the broader national picture. Across the country, adult co-residence with parents has increased steadily since the early 2000s, with a notable rise following the Great Recession and another surge during the COVID-19 period. According to recent analysis from Pew Research Center, about 18% of adults ages 25–34 were living with at least one parent in 2023, a level significantly higher than in the 1980s and 1990s. This shift reflects changing economic conditions and social norms rather than a temporary anomaly. National data now treats adult living with parents as a mainstream arrangement rather than an exception, particularly for younger working-age adults navigating housing and employment pressures.
2.1 Historical and Current Trends
Historically, most Americans in their late twenties and early thirties lived independently, often forming new households through marriage or long-term partnerships. Census-based studies show that in 1960, fewer than one in ten adults ages 25–34 lived with parents. By contrast, the 2023 figure of roughly 18% marks a clear structural change. Gender differences persist: men in this age group are more likely to live at home than women, with estimates of around 20% for men versus about 15% for women, based on national household surveys analyzed by Pew Research. These trends suggest delayed household formation and longer transitions into full economic independence, reshaping assumptions about adulthood in modern America.
2.2 Factors Influencing Co-Residence
Several forces drive these national patterns. Wage growth for young workers has lagged behind housing costs, particularly in urban labor markets. Student debt burdens delay savings and homeownership, while unstable early-career employment encourages financial caution. Cultural norms have also shifted, with living at home increasingly seen as practical rather than stigmatized. Together, these factors explain why co-residence has become more common across racial and ethnic groups. However, national averages conceal important variation, which becomes especially visible in high-cost states like California where these pressures are intensified.
| Metric | 2023 U.S. Estimate |
| Adults ages 25–34 living with parents | ~18% |
| Men ages 25–34 | ~20% |
| Women ages 25–34 | ~15% |
3. California’s Adults At Home: Overall Percentages and Patterns
What study finds record number of young adults live at home in the United States:
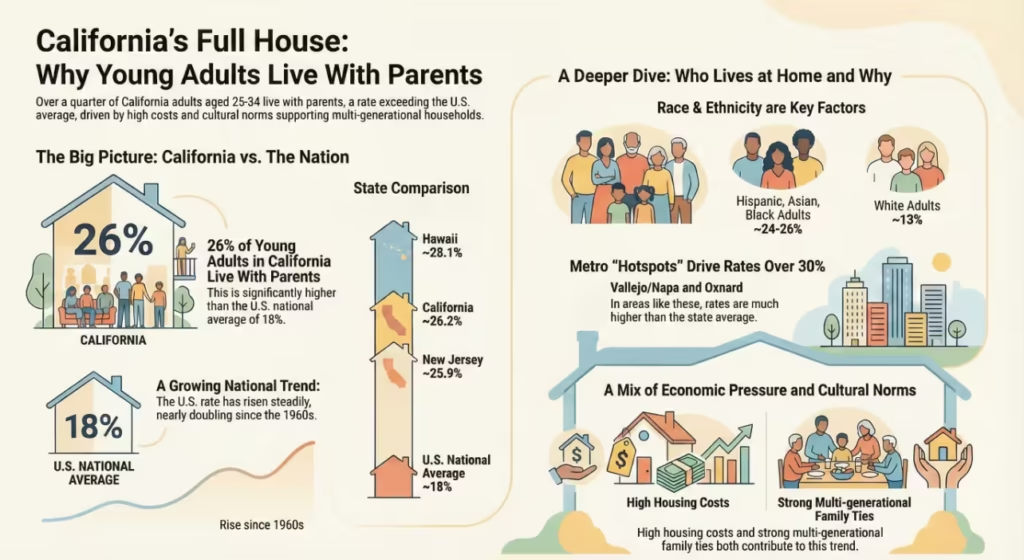
California stands out even within this national context. State-level housing data and census-based analysis show that approximately 26.2% of Californians ages 25–34 live with their parents, well above the U.S. average. This places California among the states with the highest rates of adult co-residence, alongside Hawaii and New Jersey. Analysts at Eye on Housing, using American Community Survey data, consistently identify California as a high-co-residence state. The scale of the difference underscores how state-specific conditions shape household decisions, particularly for younger adults attempting to balance employment opportunities with housing affordability.
3.1 Statewide Snapshot
When compared to other states, California’s figures reveal a clear pattern. Hawaii, another high-cost state, reports rates near 28.1%, while New Jersey stands at about 25.9%. The U.S. national average remains closer to 18%, highlighting the outsized role of housing markets in coastal states. In California, adult living with parents is common not only in large metro areas but also in inland regions where wages remain lower relative to housing and transportation costs. This statewide snapshot shows that co-residence is not limited to a single demographic or city type.
3.2 Why California Is Distinctive
Several structural factors explain why California differs from much of the country. Housing costs in the Bay Area, Los Angeles, and San Diego rank among the highest nationwide, often outpacing wage growth even in high-skill industries. California’s economy is also uneven, combining high-paying technology and entertainment sectors with large service and agricultural workforces. In addition, strong cultural ties within immigrant and multi-generational households contribute to acceptance of shared living arrangements. These combined factors make California a unique case study for understanding adult co-residence.
| Region | % Living with Parents (Ages 25–34) |
| California | ≈ 26.2% |
| U.S. National Average | ≈ 18% |
| Hawaii | ≈ 28.1% |
| New Jersey | ≈ 25.9% |
4. Racial and Ethnic Variations in Living With Parents
Examining race adds another layer to the analysis. While detailed statewide California tables breaking down living arrangements strictly by race are limited, researchers rely on national surveys and metro-level studies to infer patterns. These sources consistently show that demographic living arrangements by race differ in meaningful ways. California’s racial diversity means these national patterns are particularly relevant when interpreting state-level trends.
4.1 National Patterns That Inform California Trends
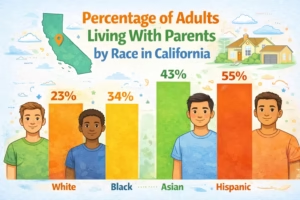
National data from Pew Research on multigenerational households indicates that White young adults are generally less likely to live with parents compared to their Asian, Hispanic, and Black peers. Estimates suggest that about 13% of White adults live with parents, compared with roughly 24–26% among Asian, Hispanic, and Black adults. While these figures are national, analysts note that California’s racial composition and housing pressures likely reinforce similar differences within the state. These disparities reflect both cultural norms and economic positioning across groups.
4.2 Why Race Matters in Living Arrangements
Race intersects with living arrangements through culture and economics. Some communities place stronger emphasis on multi-generational support, making co-residence a normative choice rather than a last resort. At the same time, disparities in income, wealth, and housing access by race influence who can afford independent living. In California’s high-cost environment, these factors combine to shape distinct outcomes across racial and ethnic groups, even when individuals share similar age or education levels.
4.3 Hypothetical Race Breakdowns (Representative)
Because California-specific race-by-household tables are not consistently published, researchers often extrapolate from national and metro-level findings. The table below reflects representative patterns rather than exact statewide measurements.
| Race / Ethnicity | Likely % of Adults Living with Parents |
| White | ~13–15% |
| Hispanic | ~24–26% |
| Asian | ~24% |
| Black | ~26% |
These estimates are informed by national multigenerational household research and applied cautiously to California due to its demographic diversity and high housing costs.
5. Metropolitan Variation: California Cities With High Rates
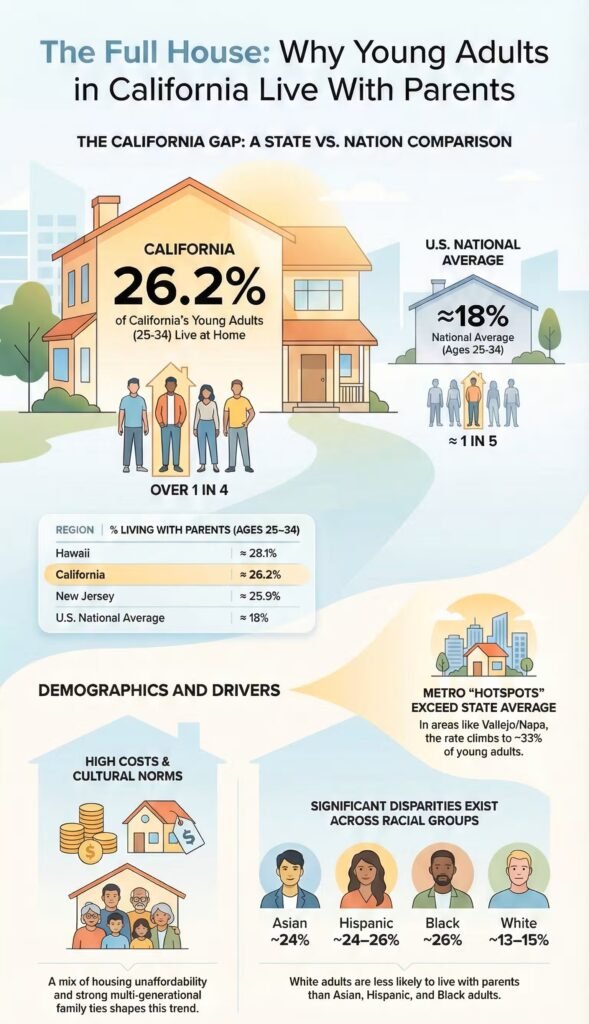
Statewide averages hide sharp local differences, which become clear when looking at metro-level data. In several California metropolitan areas, the share of adults ages 25–34 living with parents is far higher than the state average. Research summaries using American Community Survey data highlight hotspots such as Vallejo and the surrounding Napa area, where roughly 33% of young adults live at home. The Oxnard-Thousand Oaks-Ventura region follows closely at about 32.8%, while the Riverside-San Bernardino-Ontario area reports near 30%. Smaller metros like Merced also approach 30%, showing that high co-residence is not limited to coastal hubs. These patterns reflect local housing costs, job access, and community structures rather than a single statewide trend.
Metro Hotspots in California (Adults Ages 25–34)
| Metro Area | Approx. % Living With Parents |
| Vallejo / Napa | ~33% |
| Oxnard–Thousand Oaks–Ventura | ~32.8% |
| Riverside–San Bernardino–Ontario | ~30% |
| Merced | ~30% |
These figures underscore how geography shapes adult living arrangements within California.
6. Structural and Cultural Factors Affecting Living Arrangements
Understanding why adults live with parents requires separating structural pressures from cultural preferences. In California, both forces operate at the same time. Structural conditions such as housing supply, wages, and regional job markets set the boundaries of choice, while cultural norms shape how families respond within those limits. In many cases, cultural background plays a role similar to how people explore identity using an Ethnicity Percentage Calculator, where broader categories are broken down into meaningful components. Metro-level variation shows that even areas with similar rent levels can have different co-residence rates, suggesting economics alone does not explain the trend. Researchers therefore view adult living with parents as the result of layered influences, where financial realities intersect with long-standing family and cultural practices.
6.1 Economic Conditions
Economic conditions remain a central driver of adult co-residence in California. Housing affordability is a persistent challenge, with rent and home prices outpacing wage growth across many regions. Young workers often face high entry-level housing costs alongside student loan obligations and uneven job security. Even when national studies find no simple one-to-one link between rent levels and living arrangements at the metro scale, the broader economic context still shapes decisions. Living with parents allows adults to reduce expenses, save income, and remain close to employment centers that would otherwise be unaffordable. In this sense, co-residence functions as an economic adjustment strategy in a state where housing markets are among the most expensive in the country.
6.2 Cultural Norms
Cultural norms also play a clear role in shaping living arrangements. In many communities, multi-generational households are common and socially accepted. Hispanic cultural traditions, for example, often emphasize extended family support, shared resources, and close intergenerational ties. Similar patterns exist in several Asian and immigrant communities across California. In these contexts, living with parents may signal family cooperation rather than economic strain. Cultural expectations can therefore reinforce co-residence even when individuals are employed. Researchers note that cultural norms do not replace economic factors but interact with them, influencing how families respond to high housing costs and uncertain labor markets while maintaining strong social bonds.
7. What This Means for Policy, Society, and Individuals
For policymakers and economists, rising adult co-residence rates signal broader structural challenges. In housing policy, high shares of young adults living with parents point to shortages of affordable rental options for young workers. From a labor economics perspective, co-residence can help workers manage debt and withstand job instability, but it may also delay household formation and reduce geographic mobility. Socially, families provide informal financial support that affects consumer spending and housing demand. These dynamics influence tax bases, urban planning, and long-term population growth. Understanding who lives with parents, and why, helps decision-makers anticipate future needs in housing supply, transportation, and workforce development across California’s diverse regions.
8. Frequently Asked Questions
How many adults live with their parents in California?
About one in four young adults in California live with a parent. State analysis using recent American Community Survey data places the share of adults ages 25–34 living with a parent at roughly 26% notably higher than the U.S. average.
What percentage of adults still live with their parents (U.S. context)?
Nationally, roughly 18% of adults ages 25–34 lived with at least one parent in 2023. That share rose substantially compared with mid-20th century patterns and remains higher than historical norms.
At what age do most people stop living with their parents?
Moving out commonly occurs in the mid-to-late twenties; many people leave parental homes by ages 25–29, though milestones vary by cohort and country. Recent household-milestones research shows later departures and delayed household formation compared with previous generations.
Why are men more likely to live with their parents?
Men are more likely to live with parents in part because of later marriage and household formation, different labor market outcomes, and social patterns that make young men more likely to return home after job disruptions. Surveys show young men (aged 25–34) are more likely than women to live with parents (about 20% vs. 15% nationally).
What is the population breakdown by race in California?
According to recent Census QuickFacts (2019–2023 estimates), California’s population is diverse: Hispanic or Latino ~40.8%, White alone, not Hispanic or Latino ~33.6%, Asian alone ~17.0%, with smaller shares for Black, Native American, and Pacific Islander groups. These categories are the primary race/ethnicity groupings used for state analysis.
What is the whitest county in California?
By county percentages, rural and mountain counties show the highest shares of non-Hispanic white residents. Sources frequently list Nevada County and several interior counties (e.g., Mariposa, Calaveras, Lassen) among the highest-percentage white counties in California. For county-level confirmation, use Census county tables or IndexMundi county quick facts.
Which ethnic or racial identity has the greatest proportion of single-parent households?
U.S. data indicates Black children have the highest share living in single-parent households, followed by Hispanic children; white children have lower rates by comparison. National child-family data show large differences across groups that reflect economic and historical factors.
What race has the most fatherless homes?
National statistics on household composition show that Black families have the largest share of children living with a single parent (most often the mother), a pattern documented across federal and research sources. These findings are framed by broader socioeconomic and policy contexts.
What race is most likely to be single?
Rates of single (never-married) adults vary by age and group, but recent analyses often find higher shares of single adults among Black and Hispanic young adults compared with White and Asian peers, driven by differential marriage timing and economic conditions. Exact percentages depend on age cohort and the metric used (never married vs. currently single).
Why are Black mothers more likely to be single?
Higher rates of single motherhood among Black women reflect a mix of historical, structural, and economic factors: disparities in employment and incarceration rates among men, historical patterns of marriage and family formation, and unequal access to stable wages and housing. Researchers stress that these are structural explanations rather than cultural stereotypes.
Is California’s rate of young adults living with parents higher than the national average?
Yes. More than one-quarter of Californians ages 25–34 live with parents, compared with about 18% nationally.
Do rates differ by race?
National research indicates White young adults live with parents at lower rates than Asian, Hispanic, and Black peers, a pattern likely reflected in California.
Why are more adults living with parents?
Economic pressures, housing costs, and shifting cultural norms all contribute.
Has this trend changed over time?
Yes. Rates rose over recent decades and increased sharply during the pandemic, with signs of stabilization in some regions afterward.
9. Suggestions: Understanding Racial Patterns in Co-Residence in California
California’s living-with-parents trend stands out nationally, with higher overall rates and strong metro-level variation. While statewide racial breakdowns are limited, national data and regional analysis show that race and culture shape how families respond to economic pressures. High housing costs, uneven wages, and cultural traditions combine to influence who lives at home and for how long. For researchers and policymakers, examining these patterns is essential for understanding housing demand, labor mobility, and household formation. Broad percentages describe the scale of co-residence, but race- and metro-level analysis reveals how community, economy, and culture work together to shape everyday living arrangements across California.
Data Sources and References
| # | Source (title) | Publisher / Org | Why authoritative | Key data used (how it supported our article) | Link (citation) |
|---|---|---|---|---|---|
| 1 | The shares of young adults living with parents vary widely across the U.S. | Pew Research Center | Pew produces rigorous, transparent analysis of Census/ACS data and is widely cited for household & multigenerational trends. | National and metro shares for adults living with parents (2023 estimate ~18% for ages 25–34; gender splits; metro hotspots such as Vallejo, Oxnard). | (Pew Research Center) |
| 2 | U.S. Census Bureau – QuickFacts: California | U.S. Census Bureau | Official federal population counts and 1-year/5-year ACS estimates – best source for state race/ethnicity breakdowns. | California race/ethnicity percentages (White non-Hispanic, Hispanic/Latino, Asian, etc.) used for population breakdown context. | (Census.gov) |
| 3 | The demographics of multigenerational households (report & PDF) | Pew Research Center (report PDF) | In-depth report on multigenerational household trends, methodology, and historical context. | Historical trends and methodology for multigenerational household estimates and race/ethnicity patterns. | (Pew Research Center) |
| 4 | America’s Families and Living Arrangements: 2022 (P20-587) | U.S. Census Bureau (Population Division) | Official report analyzing family structure, single-parent households, and living arrangements across demographic groups. | National tables on children living with single parents; parental cohabitation and family structure by race (used for single-parent & fatherless-home context). | (Census.gov) |
| 5 | Children in single-parent families by race and ethnicity (data table) | Annie E. Casey Foundation / KIDS COUNT Data Center | Aggregated, accessible child-welfare statistics with clear race/ethnicity breakdowns; useful for child- and family-structure comparisons. | Percentages of children in single-parent families by race/ethnicity (used to support statements about which groups have higher single-parent rates). | (datacenter.aecf.org) |