Dating Concept or Metric | Statistical Impact | Population Reality | Perception Distortion Factor | Suggested Strategy | Inferred Societal Outcome |
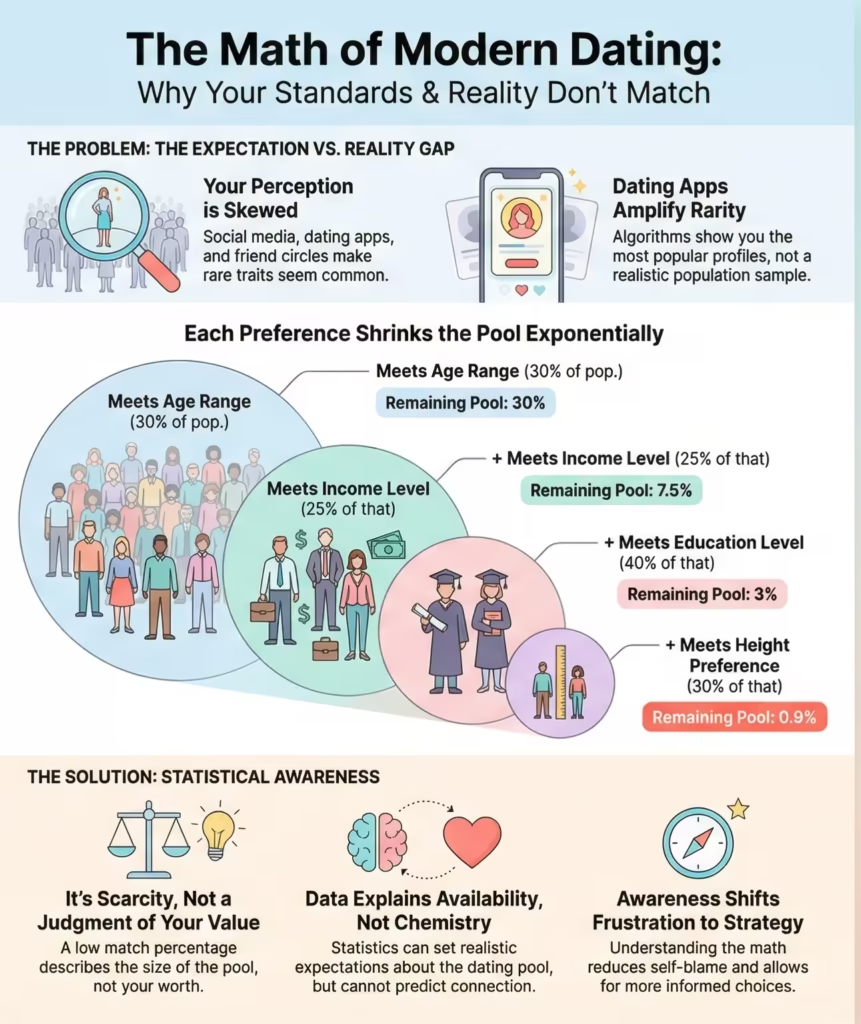
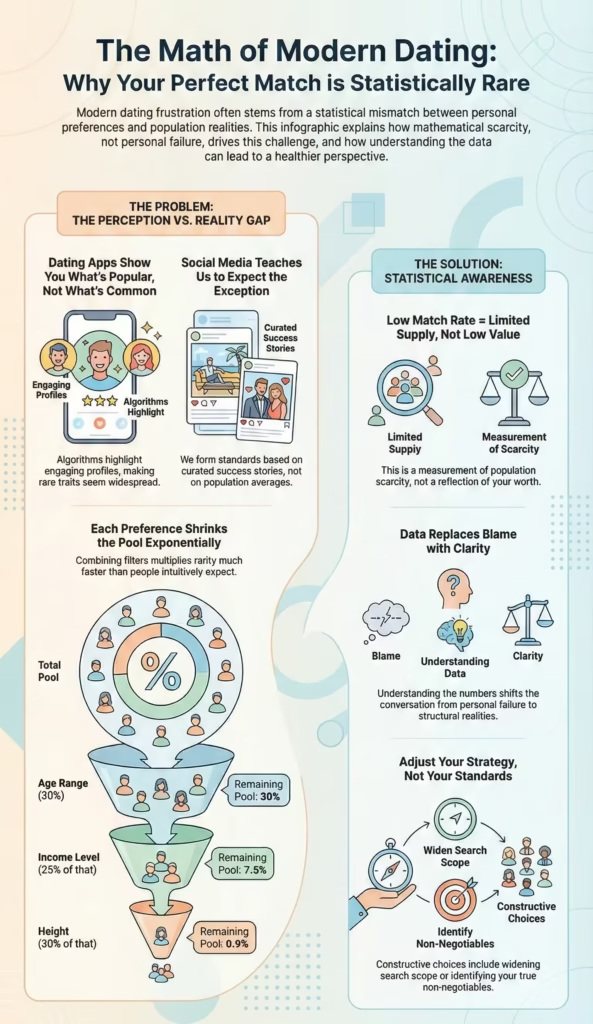
Preference Stacking | Reduces availability exponentially as probability works multiplicatively, not additively. | Each preference (age, income, height) compounds rarity; four standard filters can leave <1% of the population. | Individual filters seem reasonable in isolation, masking the collective scarcity they create. | Identify core versus optional preferences and prioritise fewer non-negotiable traits. | Increased dating frustration and prolonged search times for individuals with high standard density. |
Demographic Distribution (Income/Height) | Most adults cluster around the median; extreme percentiles are numerically small. | Six-figure incomes and extreme height percentiles represent a narrow minority of the total pool. | Social media and urban samples concentrate specific demographics, mistaken for national wholes. | Widen geographic scope and align expectations with measurable census data distributions. | A growing gap between aspirational standards shaped by media and the actual availability of partners. |
Algorithmic Visibility | Algorithms rank profiles based on engagement rather than representing population balance. | Rare traits (high earners, specific heights) are over-represented due to selection bias. | Exposure bias creates an illusion that exceptional traits are widespread and normal. | Reduce reliance on app-based exposure alone to regain a realistic sense of population averages. | Skewed market expectations where average profiles become invisible to the majority of users. |
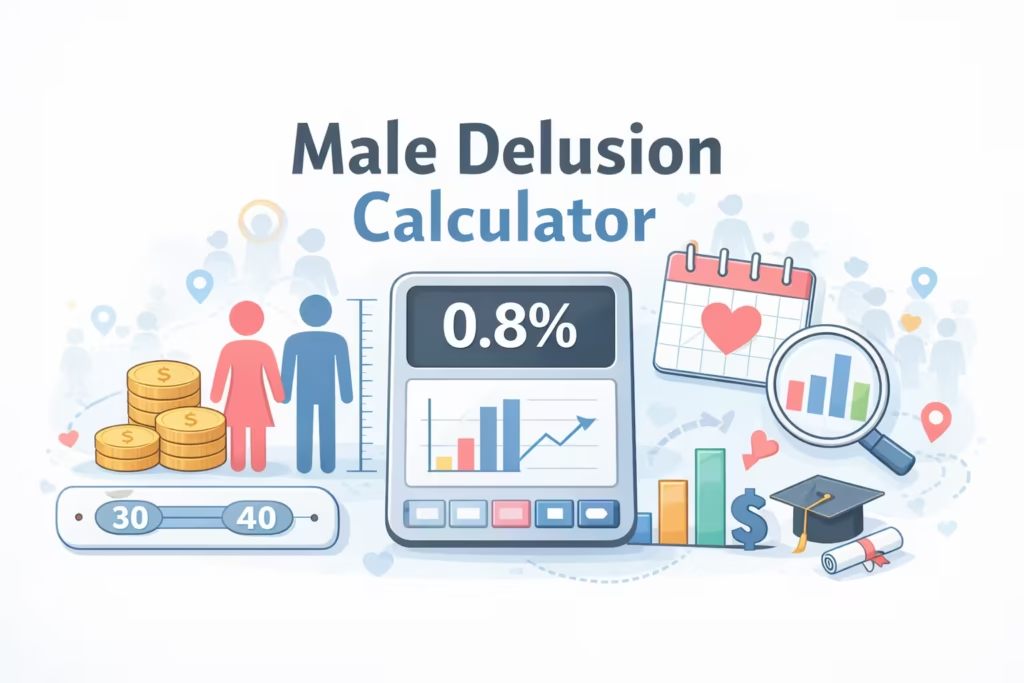
Low Match Percentages | Reflects population scarcity (e.g. 0.5% or 1%) rather than personal failure. | A small pool indicates higher competition and longer timelines, not impossibility of connection. | Numbers are interpreted as emotional evaluations or personal rejections rather than measurements. | Remove shame from the process by treating statistics as clarification tools rather than personal verdicts. | Reduced self-blame and healthier public discourse regarding modern dating difficulties. |
Gender-Based Asymmetries | Imbalance follows when large groups select from the same small subset of traits. | Demand is concentrated on specific traits (height/income for men, age/appearance for women). | Frustration is often framed as social decline rather than a result of asymmetric demand. | Allow for longer time horizons and recognise that scarcity is often shared across groups. | Increased hostility between genders due to lack of awareness regarding structural constraints. |
Interpreting Extremely Low Match Percentages Without Moral or Personal Judgment
Low match percentages often trigger emotional reactions because numbers feel like evaluations rather than measurements. In dating contexts, a result such as 1% or 0.5% can sound like rejection, even though it reflects population scarcity rather than personal worth. These figures describe how many people statistically meet a set of filters, not how likely a connection is with any one individual. A small pool means higher competition and longer search times, not impossibility. Interpreting these numbers correctly helps remove shame and defensiveness from dating discussions. Scarcity exists in many areas of life, from housing markets to job roles, without implying failure. Dating operates under similar constraints, shaped by math rather than morality.
Key reframing points:
Low percentage = limited supply, not low value
Scarcity affects timing more than outcomes
Numbers describe pools, not people
What Demographic and Census Data Can and Cannot Explain About Human Relationships
Demographic data excels at describing structure but falls short in predicting connection. Census and survey statistics can measure age distribution, income ranges, education levels, and marital status with high accuracy. These metrics help explain why certain preferences narrow the dating pool. However, they cannot capture interpersonal dynamics such as attraction, shared humor, emotional safety, or long-term compatibility. Data explains availability, not chemistry. Confusion arises when people expect population statistics to predict personal outcomes. The value of demographic analysis lies in setting realistic expectations about scale, not in forecasting relationship success. Understanding both the power and the limits of data prevents misuse and overinterpretation.
| What Data Explains | What Data Cannot Explain |
|---|
| Population size | Emotional connection |
| Trait distribution | Mutual attraction |
| Scarcity patterns | Relationship quality |
| Competition density | Personal timing |
Why Statistical Awareness Matters in Conversations About Modern Dating Frustration
Dating frustration is often personalized, framed as individual failure or social decline. Statistical awareness shifts the conversation from blame to structure. When people understand how preference stacking reduces availability, frustration becomes easier to contextualize. This perspective lowers hostility, reduces gender-based accusations, and supports more constructive dialogue. Without data, people fill gaps with assumptions shaped by anecdote and social media. With data, patterns replace speculation. This does not remove disappointment, but it reduces confusion. Awareness helps people adjust expectations, timelines, or search strategies without feeling pressured to abandon standards. In this sense, statistics act as clarification tools rather than verdicts.
Benefits of statistical awareness include:
Reduced self-blame
Clearer understanding of competition
More grounded expectations
Healthier public discourse
Understanding the Gap Between Aspirational Standards and Population Reality
Aspirational standards reflect values, goals, and identity. Population reality reflects distribution and probability. The gap between the two widens when aspiration is shaped by visible exceptions rather than averages. Many people aim for outcomes modeled by media, peers, or online examples without realizing how narrow those outcomes are statistically. This gap does not mean aspirations are wrong; it means they carry costs. Longer searches, geographic limits, and higher competition are natural consequences. Problems arise only when this gap is invisible. Clarity allows choice. People can hold high standards while understanding the trade-offs involved, rather than experiencing repeated surprise.
Common causes of the gap:
Overexposure to exceptional cases
Underexposure to averages
Confusing desirability with availability
Suggestions: Dating Expectations in an Era of Algorithmic Visibility and Demographic Constraint
Modern dating operates within systems that amplify rarity and compress perspective. Adjusting expectations does not require lowering standards, but it does benefit from awareness. Practical responses include widening geographic scope, extending timelines, or prioritizing fewer non-negotiable traits. These are strategic choices, not compromises of self-respect. Algorithms will continue to highlight narrow segments of the population, and demographics will continue to limit overlap. Understanding both allows individuals to act deliberately rather than react emotionally. Dating outcomes improve when expectations align with structure, not when desire is abandoned.
Constructive adjustments may include:
Identifying core versus optional preferences
Allowing longer time horizons
Reducing reliance on app-based exposure alone
Frequently Asked Questions (FAQs)
1. Does a low percentage mean my standards are unrealistic?
No. A low percentage does not automatically mean your standards are unrealistic. It means that the combination of criteria you selected applies to a small portion of the population. Many reasonable preferences become rare when stacked together. The calculator highlights scarcity, not correctness. Whether standards are realistic depends on time horizon, location, and personal priorities, not on a single number.
2. Are these results accurate for my city or country?
The calculator uses national-level demographic estimates, primarily based on U.S. data. Local populations can differ significantly due to migration, urban density, and cultural factors. Large cities may increase access to certain traits, while smaller regions may reduce them. The results should be viewed as broad estimates rather than precise local measurements.
3. Why does changing one setting affect the result so much?
Each setting applies a percentage filter to the population. When one filter is tightened, it reduces the remaining pool that all other filters apply to. Because these reductions multiply, small changes can lead to large differences in results. This reflects how real-world availability shrinks as preferences become more specific.
4. Why are factors like personality or attraction not included?
Personality, attraction, and emotional compatibility cannot be measured reliably at a population level. The calculator focuses only on traits that have consistent demographic data. Its purpose is to estimate availability, not to predict relationship success or personal chemistry.
5. Is this calculator meant to tell people to lower their standards?
No. The calculator is not designed to instruct users on what they should value. It provides statistical context so users can make informed decisions. Some people may choose to adjust preferences, while others may accept longer timelines or smaller dating pools. Both responses are valid.